ROAS Calculator: Formula, Benchmarks and Free Tool
If you’re running paid ads – on Meta, Google, TikTok, or anywhere else – there’s one number that tells you faster than anything else whether your campaigns are actually working. It’s not CTR. It’s not impressions. It’s ROAS.
Return on Ad Spend is the closest thing ad operations has to a report card. One clean ratio that answers the most fundamental question in media buying: for every dollar I put in, how much came back?
This guide covers the ROAS formula, how to interpret what you’re seeing, industry benchmarks, and exactly how to use ROAS in your day-to-day operations – not just in quarterly reviews. Use the free interactive calculator below to run your numbers in seconds.
What Is ROAS (Return on Ad Spend)?
ROAS stands for Return on Ad Spend. It measures the revenue generated for every unit of currency you spend on advertising. Unlike ROI (which factors in all business costs), ROAS is laser-focused on your ad spend alone – making it the go-to metric for campaign-level performance analysis.
The metric is expressed as a ratio or a multiple. A ROAS of 4x means you earned $4 in revenue for every $1 you spent on ads. Simple, direct, and instantly comparable across campaigns, channels, and time periods.
ROAS became the standard in performance marketing because it’s channel-agnostic. Whether you’re measuring a Meta Advantage+ campaign, a Google Performance Max campaign, or a TikTok Spark Ad – the formula is the same. That consistency makes it genuinely useful for cross-channel budget decisions.
The ROAS Formula
The ROAS formula couldn’t be simpler:
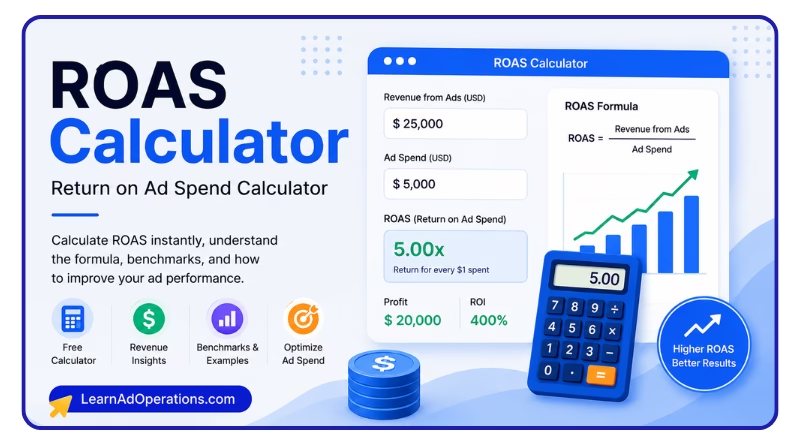
ROAS = Revenue Generated from Ads ÷ Ad SpendSo if you spent $5,000 on a campaign and generated $20,000 in revenue attributed to those ads:
ROAS = $20,000 ÷ $5,000 = 4xThat’s a 4x ROAS – meaning for every dollar spent, four came back. You can also express this as a percentage (400%), but in practice, the “x” multiplier format is far more common in ad ops conversations and platform dashboards.
What Counts as “Ad Spend”?
This is where teams often get tripped up. Ad spend should include everything you pay the platform – your media cost, any impressions-based fees, and campaign-level add-ons. It typically does not include agency fees, creative production costs, or tool subscriptions, unless you’re calculating a broader blended ROAS. Be consistent with your definition across all reports or your benchmarks will be meaningless.
What Counts as “Revenue”?
Revenue should be the attributed conversion value – what your ad platform reports as revenue driven by those specific ads, based on your pixel or conversion event setup. On Meta Ads, this shows up as “Purchase Value.” On Google Ads, it’s “Conversion Value.” For lead-gen campaigns without direct purchase tracking, you may need to use an estimated revenue per lead instead.
| ROAS | What It Means | Typical Industry |
|---|---|---|
| < 1x | Spending more than earning — losing money | Any (loss-making) |
| 1x – 2x | Breaking even or marginal returns | High-margin DTC, Brand awareness |
| 2x – 4x | Decent — but check profit margins | eCommerce, B2B SaaS |
| 4x – 6x | Healthy — strong campaign performance | Retail, Lead Gen |
| 6x – 10x | Excellent — scale what’s working | High-performing eCommerce |
| > 10x | Outstanding — rarely sustained at scale | Niche, brand-heavy, organic amplified |
How to Use the ROAS Calculator
The interactive calculator below has three modes built for different day-to-day scenarios you’ll actually run into as an ad ops professional.
Tab 1 — ROAS Calculator
The core tool. Enter your total ad spend and the revenue generated from those ads. Hit calculate and you’ll get your ROAS ratio, your Ad ROI percentage, your net profit or loss, and a graded performance rating with a plain-language explanation of what it means.
Tab 2 — Target Revenue Planner
Working backwards from a goal? This one’s for you. Enter your planned budget and the target ROAS your client or stakeholder wants to hit — the calculator tells you exactly how much revenue those ads need to generate. Useful before campaign launch, during budget approval meetings, or when a client says “we want a 5x ROAS on $50k.”
Tab 3 — Break-even ROAS
This tab answers a question most beginners skip entirely: what is the minimum ROAS you need before you start making money? Enter the selling price and cost of your product — the calculator works out your gross margin and the minimum ROAS floor. Any campaign sitting below that number is losing money, regardless of what the dashboard looks like.
What Is a Good ROAS? Industry Benchmarks by Channel
The honest answer is: it depends on your margins. A 3x ROAS can mean totally different things depending on whether you’re selling a 70% margin SaaS subscription or a 15% margin consumer electronics product. That said, here are the general benchmarks that come up most in performance marketing conversations.
General ROAS Benchmarks
- Below 1x: You are losing money. Pause and investigate.
- 1x – 2x: Breaking even or barely profitable. Only acceptable for brand awareness campaigns where lifetime value (LTV) justifies it.
- 2x – 4x: Moderate. Workable in high-margin businesses, but most campaigns should be targeting higher.
- 4x – 6x: Healthy. This is where most well-optimised direct response campaigns land.
- 6x – 10x: Strong. Scale these ad sets aggressively.
- Above 10x: Outstanding — but verify your attribution setup. Unusual spikes can sometimes indicate tracking anomalies.
ROAS Benchmarks by Ad Platform
Different platforms have different average ROAS ranges due to their auction dynamics, audience intent, and placement formats:
- Google Search Ads: Average ROAS tends to be higher (4x–8x) due to high purchase intent from search queries.
- Meta Ads (Facebook/Instagram): Typically 2x–5x for eCommerce; lower for awareness-heavy campaigns.
- TikTok Ads: Often 1.5x–3.5x as a newer performance channel; creative quality is the biggest variable.
- Google Shopping: Often 3x–6x for well-optimised product feeds.
- YouTube Ads: Tends to be lower (1.5x–3x) because of upper-funnel intent, but drives assisted conversions.
These are averages. Your specific category, season, and creative will move these numbers significantly in either direction.
ROAS vs ROI: What’s the Difference?
This comes up constantly, and it matters. ROAS and ROI are related but they’re measuring different things.
- ROAS measures revenue relative to ad spend only. It doesn’t account for COGS, overhead, salaries, or any other business cost.
- ROI (Return on Investment) factors in your total investment — including all costs — to tell you true profitability.
A campaign with a 5x ROAS sounds great. But if your product costs 80 cents to make for every dollar it sells for (20% margin), a 5x ROAS still doesn’t make you profitable after accounting for cost of goods. That’s why your break-even ROAS — which you can calculate in Tab 3 above — is the number you should never let a campaign fall below.
Use ROAS to evaluate campaign performance day-to-day. Use ROI for strategic budget decisions and business-level reporting.
ROAS vs ROI vs CPA: Key Advertising Metrics Explained
| Metric | Formula | Purpose |
|---|---|---|
| ROAS | Revenue ÷ Ad Spend | Measures ad efficiency |
| ROI | Profit ÷ Investment | Measures profitability |
| CPA | Spend ÷ Conversions | Measures acquisition cost |
How to Use ROAS in Day-to-Day Ad Operations
ROAS isn’t just a number you report once a month. In a well-run ad ops function, it’s part of your daily workflow. Here’s how that looks in practice.
1. Set Campaign-Level ROAS Targets Before Launch
Before any campaign goes live, use the Target Revenue Planner to set a clear ROAS floor. Share this with your client or stakeholder. “This campaign needs to deliver at least 3.5x ROAS to be viable” is a much cleaner brief than “let’s see how it performs.”
2. Use ROAS for Daily Budget Pacing Decisions
Check ROAS daily across active ad sets. Any ad set running significantly below target for 3+ days in a row deserves a creative refresh or a pause. Any ad set well above target is a candidate for a budget increase. Most platforms (Meta, Google) allow you to set automated rules to pause or scale based on ROAS thresholds — set these up so you’re not making these calls manually every morning.
3. Compare ROAS Across Audiences and Creatives
ROAS is your simplest A/B test arbiter. When you’re split-testing audiences or ad creatives, sort your results by ROAS. Stop spending on anything below your break-even threshold and funnel that budget to your top performers. This is standard practice in any performance media team worth its salt.
4. Report ROAS Alongside Context
Raw ROAS numbers without context can mislead stakeholders. A 6x ROAS during a sale period looks less impressive when you factor in the 40% discount on every order. Always report ROAS alongside average order value, revenue volume, and — where possible — margin. That’s the full picture.
5. Track ROAS Trends, Not Just Point-in-Time Numbers
A declining ROAS over four weeks is a much bigger warning signal than a single bad day. Build a simple ROAS trend tracker in your reporting dashboard or even a Google Sheet. Patterns matter more than snapshots in ongoing campaign management.
Common ROAS Mistakes to Avoid
Even experienced media buyers make these errors – especially under client pressure or when managing large account volumes.
- Optimising for ROAS without knowing your margin. A 4x ROAS on a 20% margin product is a money-losing campaign. Always know your break-even ROAS first.
- Conflating platform-reported ROAS with actual business revenue. Attribution windows, view-through conversions, and cross-device tracking all introduce discrepancy. Triangulate with your own data.
- Setting the same ROAS target for all campaign objectives. A retargeting campaign should hit higher ROAS than a cold prospecting campaign. Set targets by funnel stage.
- Panicking over short-term ROAS dips. Seasonality, creative fatigue, and algorithm learning phases will cause temporary drops. Make decisions based on statistically meaningful data windows – typically 7–14 days minimum.
- Ignoring blended ROAS. Platform-level ROAS looks at each channel in isolation. Blended ROAS (total revenue ÷ total ad spend across all channels) gives you the truer business picture. Look at both.
Frequently Asked Questions About ROAS
A 4x ROAS means you generated $4 in revenue for every $1 spent on ads. On a $10,000 ad budget, that’s $40,000 in attributed revenue. Whether that’s profitable depends on your product margins and business costs.
Not necessarily. An extremely high ROAS (say, 20x) on a tiny budget often means you’re under-spending relative to your market opportunity. Scaling spend almost always lowers ROAS somewhat as you reach less targeted audiences. There’s a sweet spot – find the budget level where ROAS stays above your break-even threshold while revenue volume is maximised.
For most eCommerce businesses on Meta Ads, a 3x–5x ROAS is considered solid. High-margin products can sustain lower ROAS; low-margin products need higher. Always calculate your break-even ROAS for your specific business before judging whether your Meta ROAS is “good.”
Start by identifying where in the funnel you’re losing. Low ROAS can come from poor audience targeting, weak creative, a bad landing page, low average order value, or attribution gaps. Don’t try to fix everything at once – isolate variables and test one change at a time.
Target ROAS (tROAS) is a Google Ads bidding strategy where you tell the algorithm what ROAS you want to achieve. Google’s smart bidding then adjusts bids in real time to try to hit that target. It works best when you have at least 30–50 conversions in the past 30 days to give the algorithm enough data.
Final Thoughts
ROAS is one of those metrics that looks deceptively simple on the surface. The formula takes five seconds to learn. But using it well – knowing your margin floor, reading trends, comparing across channels, and making the right budget calls – that’s where real ad ops skill lives.
Use the calculator above as your starting point. Bookmark it. Share it with your team. And if you found it useful, check out the rest of the free tools and resources on LearnAdOperations.com.
Built for ad operations professionals by LearnAdOperations.com. All calculations are for reference only. Always validate with your actual platform and business data.